countryscales extends scales and ggplot2 by providing functions to make it easy to display numbers or label axis text on positional scales in decimal format, as percentages or currencies using country- or locale-specific style conventions.
Installation
You can install the development version of countryscales from GitHub using:
remotes::install_github("trekonom/countryscales")Usage
The most common use case for countryscales is to customize the appearance of axis and legend labels or format numbers added as labels to a plot using country-specific style conventions.
Here’s an example showing how 1 million USD are formatted in the G20 countries:
library(countryscales)
library(ggplot2)
library(dplyr, warn.conflicts = FALSE)

g20 <- countryscales::g20 |>
  # India is not supported
  filter(iso2c != "IN") |>
  mutate(
    x = factor(rep(1:2, 9)),
    y = factor(rep(9:1, each = 2)),
    country = if_else(iso2c %in% c("US", "GB"), paste("the", country), country),
    locale = if_else(iso2c == "CN", "zh-Hans-CN", locale),
    value = purrr::map_chr(
      locale,
      ~ label_currency_locale(locale = .x, currency = "USD")(1e6)
    )
  )

ggplot(g20, aes(x = x, y = y)) +
  geom_label(
    aes(label = paste(value, "in", country), fill = country),
    label.padding = unit(5, "pt"), label.r = unit(8, "pt"),
    color = "white"
  ) +
  theme_void() +
  labs(
    title = "1 million USD are formatted as"
  ) +
  guides(fill = "none")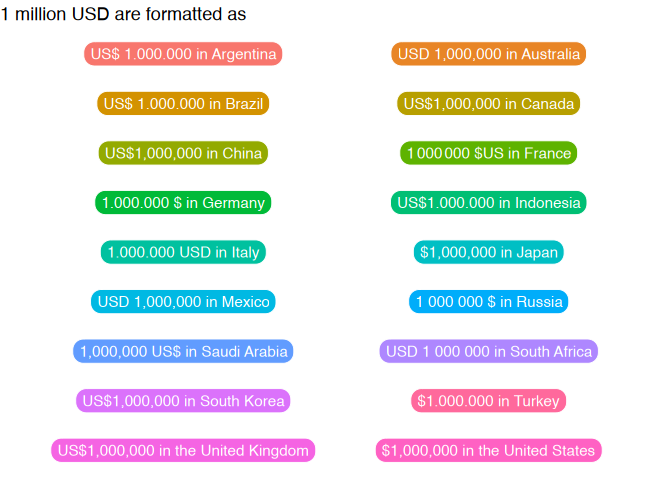
As another example, let’s look at formatting a chart according to German style conventions, where a dot (.) is used as the big mark.
base <- gapminder15 |>
  count(region, wt = pop) |>
  ggplot(
    aes(n, reorder(region, n),
      fill = region
    )
  ) +
  scale_fill_brewer(palette = "Dark2") +
  geom_col(width = .6) +
  theme_minimal() +
  labs(
    x = NULL, y = NULL,
    title = "Default"
  ) +
  guides(fill = "none")
With the countryscales package we can use the scale_x/y_xxx_locale and label_xxx_locale functions to add labels and format the axis of the base plot according to German style conventions like this:
base +
  geom_label(
    aes(
      label = label_number_locale(
        locale = "de-DE", accuracy = 1000
      )(n)
    ),
    hjust = 1, fill = NA,
    label.size = NA, color = "white"
  ) +
  scale_x_number_locale(
    locale = "de-DE",
    expand = expansion(mult = c(0, .05))
  ) +
  labs(title = "German style conventions.")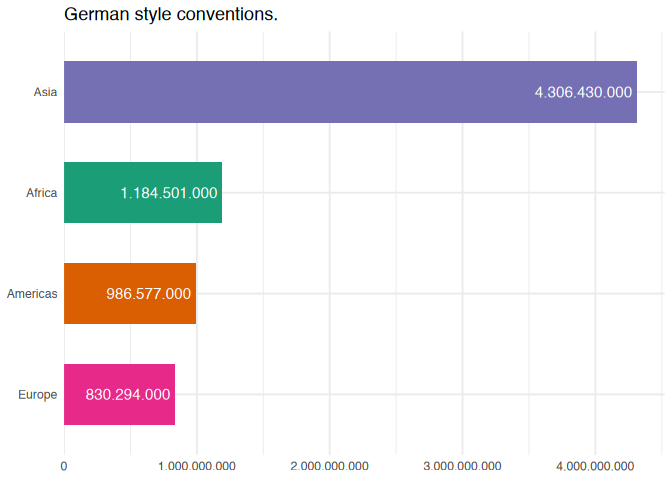
countryscales also has some handy functions for common locales. For instance, you can use label_number_ch and scale_x_number_ch to format the plot using Swiss style conventions:
base +
  geom_label(
    aes(
      label = label_number_ch(accuracy = 1000)(n)
    ),
    hjust = 1, fill = NA,
    label.size = NA, color = "white"
  ) +
  scale_x_number_ch(
    expand = expansion(mult = c(0, .05))
  ) +
  labs(title = "Swiss style conventions.")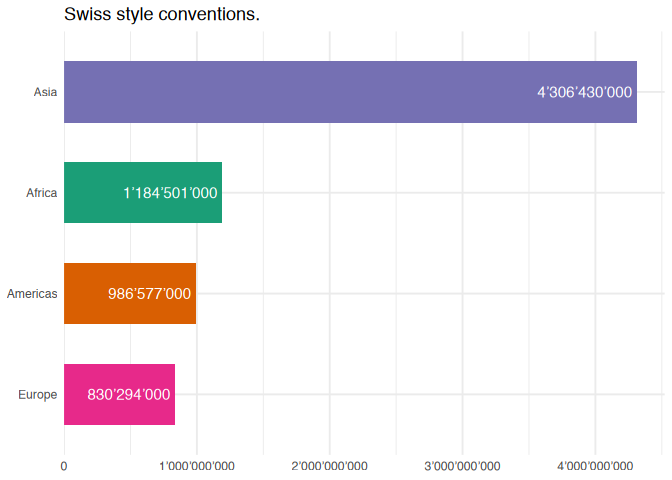
Note on supported locales
countryscales uses data on locale-specific numbering formats from the Common Locale Data Repository (CLDR) provided for easy use in R by the i18n package. Right now countryscales supports 552 of the 574 locales listed in i18n. Not supported are locales which deviate from the international norm for grouping digits by threes. This includes locales using the Indian numbering system which
groups the rightmost three digits together (until the hundreds place), and thereafter groups by sets of two digits.
Note on tests
The label_xxx_locale family of functions are tested against the output of Intl.NumberFormat to ensure correctness for each supported locale. For example, to test that label_currency_locale correctly formats numbers as currencies in the German locale, the output is checked against the output of the JS code
Credits
countryscales would not be possible without the work by other people:
Thanks to the people who contributed to the Common Locale Data Repository which provide all the data to support the world’s languages in software.
Thanks to Rich Ianonne for providing the CLDR data for easy use in R via the
i18npackage. Additionally, the design of hex logo for thecountryscalespackage was heavily inspired by thei18nhex logo.Thanks to Bob Rudis, who similar in spirit to where I started provides convenience functions
scale_x/y_percent/number/dollarforggplo2via hrbrthemes package, which served as blueprints for thescale_x/y_percent/number/currency_localefamily of functions.-
Last but not least thanks to the authors of the
scalespackage and the people at Posit. When I started withcountryscalesI thought that I simply have to provide some wrappers around function already provided byscales. But I quickly realised that localization is a complex world on its own.First, when it comes to formatting currencies, e.g. the correct positioning of the currency symbol and the minus sign, I realised that there are some cases which can’t be dealt with using
scales::label_numberorscales::label_currency. Hence, under the hoodcountryscalesuses a modified version oflabel_numberto format numbers as currencies.Second, I learend that minus signs, percent signs, … include Unicode control characters in several locales for bidirectional text control. Unfortunatly,
scales::label_numberdoes not allow to pass custom symbols for minus or plus symbols. Hence, under the hoodcountryscalesuses a modified version oflabel_numberto (mainly) account for Unicode control characters.